

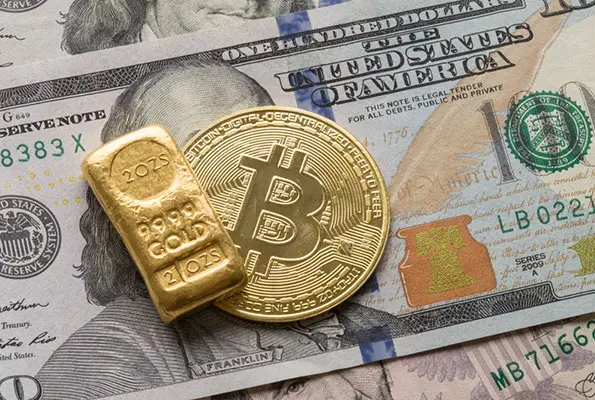
This move, he claims, is fuelling a narrative that Bitcoin is a sound store of value and safe haven during times of uncertainty. BTC’s 90-day correlation with gold remains at its highest levels in data going back to 2014.
In an exclusive chat with Global Business Outlook, Mr. Rahman also talked about whether higher US Fed interest rates will be pressuring Bitcoin’s market recovery, given the fact that higher rates make fixed-yield assets more attractive than cryptocurrencies.
Excerpts from the interview.
While the Federal Reserve has kept its benchmark interest rate on hold at 3.75%-4%, after hiking it in September, analysts believe the central bank may keep rates high, potentially pressuring Bitcoin’s recovery as higher rates make fixed-yield assets more attractive. Do you agree with this view?
Following the FOMC’s October meeting and Chair Warsh’s press conference, CME fed funds futures put the odds of a 25bps rate hike in December at roughly 75%, down from almost fully priced before the meeting.
Since the policy decision, a number of Fed officials have also advocated for a gradual tightening in policy: Dallas Fed President Lorie Logan said at least two more 25bps hikes were needed, while Richmond Fed President Tom Barkin said the direction of travel is straightforward, placing more importance on a gradual pace of tightening.
Fed funds futures pricing currently shows a little over two hikes (including the December 2026 meeting) between now and the end of 2027, down from almost three prior to the October meeting. Together, that suggests a more gradually paced increase in interest rates.
Theoretically, higher rates are a headwind for risk assets, including Bitcoin (BTC), as higher borrowing costs tighten liquidity conditions. At the same time, they are also a headwind for non-yield-bearing assets such as BTC and gold. That second channel is particularly relevant now given that BTC’s 90-day correlation with gold is 51%, against 37% with the S&P 500.
Despite that, BTC has so far been able to fade higher rates and rate expectations from the Fed and the market. It rallied after the September FOMC meeting to a high of USD 87,000, extending the move that began in August on the back of the Treasury buyback announcement, even as a further hike was being priced for December.
The USD 80,000 range is a key area to watch, particularly given BTC’s failure so far to recapture that level after the Binance hack incident. However, options markets also provide a strong gauge for forward-looking market expectations.
Currently, the demand for downside protection remains strong, though it has eased from its extremely bearish levels on October 30, in tandem with the pullback in pricing for a more hawkish path of monetary policy.
ETH’s seven-day 25-delta put premium, a measure of trader demand for put options over call options, is around -6.1 vol points. While that is far less than the -14.7 vol points seen at the time of the Binance hack, it is an indication of the bearish market sentiment. BTC’s 25-delta put-call skew is equally trading at a put premium of -3.7 vol points.
According to your estimates, investors are favouring Bitcoin over gold and potentially even equities. This shift is fuelling the narrative that Bitcoin is a sound store of value and safe haven during uncertainty. Can you explain this trend in greater detail? Your research has also examined the correlation between equities, gold and Bitcoin, suggesting that crypto is gaining ground. Can you break down the key findings and figures from your research to help our readers understand the trend?
Our analysis doesn’t specifically make a strong claim about investor preferences for Bitcoin. What we have seen over the past few months, beginning back in June 2026, is a steady move higher in Bitcoin’s (BTC) rolling 90-day correlation with gold, from around 15-25% in June to a record 55% on September 11. That took it above the previous high of 52% set in November 2020, during the pandemic era of monetary and fiscal stimulus, and it currently stands at 51%.
At the same time, we have seen a more modest decline in BTC’s correlation with US equities. In June, its 90-day correlation with the S&P 500 and the Nasdaq-100 was around 50%; that has now fallen to 37% and 36%, respectively.
Equally, BTC’s correlation with the dollar index has turned more negative over the same period, bottoming out in September at around -43% and rising a little since, to around -27%.
A higher correlation to gold at the same time as a decreasing correlation to equities could be a tentative sign of investors beginning to see BTC as a digital-gold alternative, a narrative that has been floated several times in Bitcoin’s history but is so far yet to hold.
However, correlations can shift very quickly, and while these moves are a strong signal of BTC’s resilience against prevailing macro conditions, it is too early to claim that the correlation to gold is here to stay.
While spot has been able to hold the $80,000 region for most of the period since September, a meaningful breakout from that range and move back towards all-time highs of $125,000 may require a more sustained ETF bid.
Since their launch, sustained streaks of inflows have coincided with BTC spot outperformance, while periods in which the trailing 20-session sum of flows turned negative have often seen BTC struggle. Right now, the trailing 20-session sum has turned negative again, at roughly -USD 800 million after October 30’s $643 million outflow.
Over the past 90 trading sessions, Bitcoin’s daily moves have been 1.7 times the size of gold’s. On gold’s up days, BTC averaged +1.1% against gold’s +1.0%. On gold’s down days, BTC fell 0.5% against gold’s 1.1%. Both have moved in the same direction most of the time, but BTC’s gains have been marginally larger and its losses smaller. Can you explain this pattern? Given your view that higher borrowing costs have so far proved to be a stronger headwind for gold, do you expect crypto assets to outperform the traditional yellow metal in the final two months of 2026?
Taking BTC’s and gold’s daily returns over the last 90 US trading sessions, and splitting the sessions by whether gold closed up or down, we find that from late June to the end of October, BTC and gold moved in the same direction on 63% of days, but BTC’s daily moves were about 1.7 times the size of gold’s. Gold rose on 46 of the 90 sessions, averaging +1.0%, and BTC averaged +1.1% on those days. Gold fell on the other 44, averaging -1.1%, while BTC averaged only -0.5%.
So, BTC has shared gold’s direction, but has outperformed gold on days when bullion has traded higher, and has sold off by far less on red days for gold. That asymmetry explains why over the same period, BTC has gained 27%, while gold has lost 3%.
More broadly, we’ve seen signs that the bar has been raised for a number of macro assets at once. For tech and AI equities, the investor worry is around whether earnings and revenues can justify the scale of the capex. On October 30, disappointing earnings results from a number of firms linked to the AI-buildout drove the Nasdaq-100 into its third technical correction of the year. For gold, the headwind has come from interest rate expectations.
The 30% rally over the last three months in Brent crude has raised the risk of inflation staying higher for longer and, with it, expectations of further Fed hikes. BTC has had its own headwinds, in the form of the Senate failing to advance the Clarity Act, the recent Binance incident, and a lack of consistent ETF inflows.
Seasonal patterns can offer us some clues to Bitcoin’s performance by year-end. The fourth quarter has historically been BTC’s strongest: since 2014, it has been positive in seven of twelve years with a median return of 27%, though last year BTC declined 23% in Q4.
For now, options markets suggest bearish expectations. Demand for downside protection has eased from the extremes seen in the hours after the Binance hack, but BTC’s seven-day put-call skew is still at a put premium of around 3.7 vol points and ETH’s at around 6 vol points.
Our Risk Appetite Index, a measure of sentiment, peaked in mid-September at its highest level of the year, though has since fallen steadily to around 0.6 towards a neutral zone.